Fluctuations in the Cosmic Microwave Background
The cosmic microwave background is the afterglow radiation left over from the hot Big Bang. Its temperature is extremely uniform all over the sky. However, tiny temperature variations or fluctuations (at the part per million level) can offer great insight into the origin, evolution, and content of the universe.
If you were approaching the Earth on a spaceship, the first thing you would notice is that the planet is spherical. As you drew closer to the Earth, you would see the surface divide into continents and oceans. You would need to study the Earth's surface very carefully to see the mountains, cities, forests and deserts that cover the continents.
Similarly, when cosmologists first looked at the microwave sky, thirty years ago, they noticed it was nearly uniform. As observations improved, they detected the dipole anisotropy. Finally, in 1992, the Cosmic Background Explorer (COBE) satellite made the first detection analogous to seeing "mountains on the surface of the Earth": it detected cosmological fluctuations in the microwave background temperature. Several members of the WMAP science team help lead the COBE program and build the spacecraft. COBE's detection was confirmed by the Far InfraRed Survey (FIRS) balloon-borne experiment.
| Fluctuations seen by COBE | Fluctuations seen by WMAP (Simulated) |
|---|---|
 |
 |
 |
 |
 |
 |
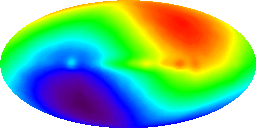
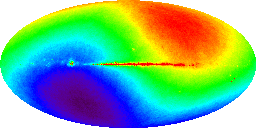
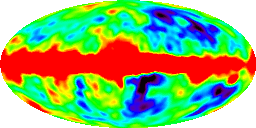
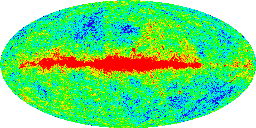
In the comparison of the images above, images on the left produced by the COBE science team, show three false color images of the sky as seen at microwave frequencies. The images on the right show one of our computer simulations of what the WMAP experiment detects. Note that WMAP detects much finer features than are visible in the COBE maps of the sky. This additional angular resolution allows scientists to infer a great deal of additional information, beyond that supplied by COBE, about conditions in the early universe.
The orientation of the maps are such that the plane of the Milky Way runs horizontally across the center of each image. The top pair of figures show the temperature of the microwave sky in a scale in which blue is 0 Kelvin (absolute zero) and red is 4 Kelvin. Note that the temperature appears completely uniform on this scale. The actual temperature of the cosmic microwave background is 2.725 Kelvin. The middle image pair show the same map displayed in a scale such that blue corresponds to 2.721 Kelvin and red is 2.729 Kelvin. The "yin-yang" pattern is the dipole anisotropy that results from the motion of the Sun relative to the rest frame of the cosmic microwave background. The bottom figure pair shows the microwave sky after the dipole anisotropy has been subtracted from the map. This removal eliminates most of the fluctuations in the map: the ones that remain are thirty times smaller. On this map, the hot regions, shown in red, are 0.0002 Kelvin hotter than the cold regions, shown in blue.
There are two main sources for the fluctuations seen in the last figure:
- Emission from the Milky Way dominates the equator of the map but is quite small away from the equator.
- Fluctuating emission from the edge of the visible universe dominates the regions away from the equator.
- There is also residual noise in the maps from the instruments themselves, but this noise is quite small compared to the signals in these maps.
These cosmic microwave temperature fluctuations are believed to trace fluctuations in the density of matter in the early universe, as they were imprinted shortly after the Big Bang. This being the case, they reveal a great deal about the early universe and the origin of galaxies and large scale structure in the universe.
